
Market · observed market structure
Quantitative market intelligence
An independent signal layer for volatility and derivatives markets.
Markets price uncertainty. Information has structure too.
Skarnode measures changes in public information and converts them into quantitative signals generated independently of market prices — then compares them with what markets are already pricing.WTI / relative volatility
strike × expiry
01 How did markets learn to represent uncertainty?
DescendEvidence
Historically ahead of the market.
5.02×
Observed lift in extreme-volatility incidence over the following 10 sessions
4.41×
Observed lift in extreme-volatility incidence over the following 5 sessions
82.4%
Directional accuracy following extreme vega dislocations — the strongest single application to date
Historical, out-of-sample statistical results. Not investment returns.
Not sentiment. Not headlines.
Structure.
Skarnode's signal is derived independently of price. That independence is what allows it to reveal moments when the information environment and the market are behaving differently.
Information has a shape too.
WTI options · strike × expiry · ATM = 1.0
Skarnode information × market geometry.
Market Information Distance
Before the surface
Uncertainty did not begin as a number.
It began as something language had to preserve: an amount owed, a price heard elsewhere, a promise exposed to time.
CLAY / PAPYRUS / WIRE / MATHEMATICSAn archaeology of market uncertainty
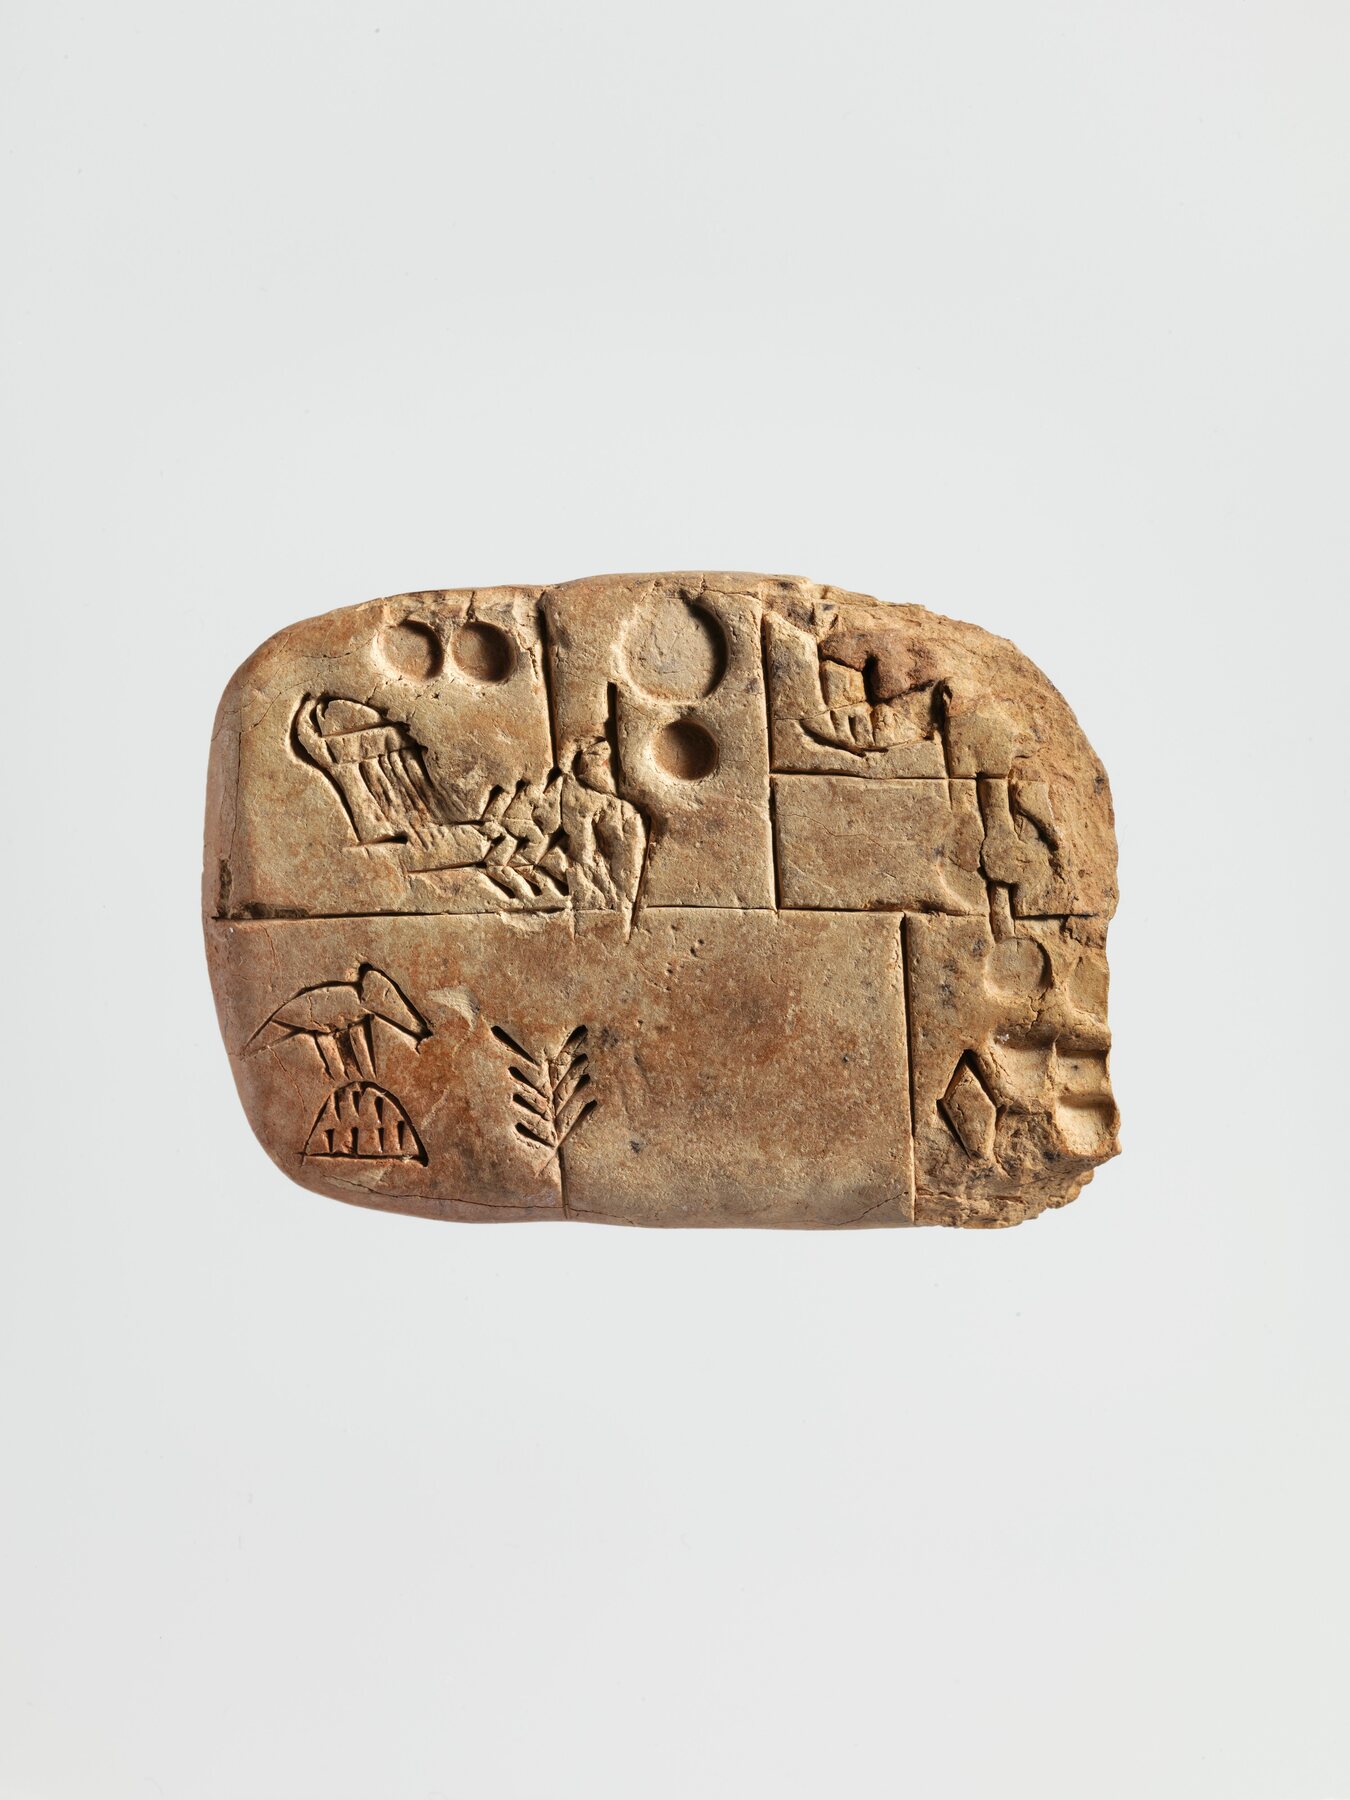
Mesopotamia · ca. 3100–2900 BCE
The market learns to remember.
Early writing preserved economic quantities: barley, emmer, distribution. A spoken exchange vanished. A mark in clay could survive the speaker.01 / 09
Skarnode
The same structure, measured today.
Skarnode's signal architecture is currently deployed on oil volatility and options markets, with vega repricing as its clearest evidence to date.